www.jagostat.com
www.jagostat.com
Website Belajar Matematika & Statistika
Website Belajar Matematika & Statistika
Cari artikel...
Tutorial R
Tutorial R
Tutorial R » Distribusi Peluang › Distribusi Student t dalam Pemrograman R
Distribusi Student-t
Distribusi Student t dalam Pemrograman R
Terdapat empat fungsi untuk menangani distribusi student-t dalam pemrograman R yakni: dt(), pt(), qt(), rt().
Distribusi student-t banyak diterapkan pada statistik inferensia. Untuk distribusi t mirip dengan distribusi normal, yang membedakan adalah parameter yang diperlukan hanyalah derajat bebas (degree of freedom/df).
Misalkan \(Z\) peubah acak normal baku dan \(V\) peubah acak chi-square dengan derajat bebas \(v\). Bila \(Z\) dan \(V\) adalah peubah acak yang independen, maka distribusi dari

diberikan oleh

Ini dikenal dengan nama distribusi-t dengan derajat bebas \(v\).
Terdapat empat fungsi untuk menangani distribusi student-t dalam pemrograman R yakni: dt(), pt(), qt(), dan rt().
                    dt(x, df, ncp, log = FALSE)
                    pt(q, df, ncp, lower.tail = TRUE, log.p = FALSE)
                    qt(p, df, ncp, lower.tail = TRUE, log.p = FALSE)
                    rt(n, df, ncp)
Argumen
x, q | vector of quantiles. |
p | vector of probabilities. |
n | number of observations. If length(n) > 1, the length is taken to be the number required. |
df | degrees of freedom (> 0, maybe non-integer). df = Inf is allowed. |
ncp | non-centrality parameter delta; currently except for rt(), only for abs(ncp) <= 37.62. If omitted, use the central t distribution. |
log, log.p | logical; if TRUE, probabilities p are given as log(p). |
lower.tail | logical; if TRUE (default), probabilities are P[X ≤ x], otherwise, P[X > x]. |
Contoh:
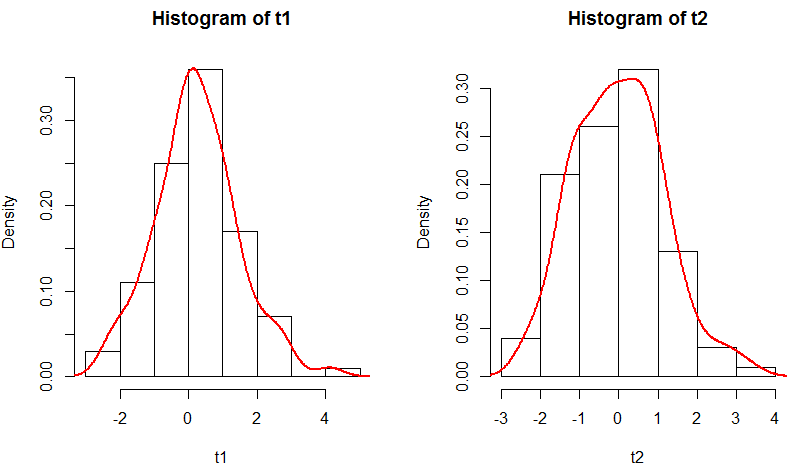
                  t1 <-rt(100, df=8)
                  head(t1)
                  [1]  0.8035731  1.2753561  2.0082214 -1.3947964 -1.8939549  0.3311537
                  t2 <- rt(100, df=20)
                  head(t2)
                  [1]  0.6589709  1.2658891 -0.5489118 -0.5617396 -0.7659511  0.5605855
                  par(mfrow=c(1,2))
                  hist(t1, probability = TRUE)
                  lines(density(t1), col=2, lwd=2)
                  hist(t2, probability = TRUE)
                  lines(density(t2), col=2, lwd=2)

Artikel Terkait
“Learn to enjoy every minute of your life. Be happy now. Don't wait for something outside of yourself to make you happy in the future.
Earl Nightingale
