www.jagostat.com
www.jagostat.com
Website Belajar Matematika & Statistika
Website Belajar Matematika & Statistika
Cari artikel...
Tutorial R
Tutorial R
Tutorial R » Distribusi Peluang › Distribusi Chi-square dalam Pemrograman R
Distribusi Chi-Square
Distribusi Chi-square dalam Pemrograman R
Terdapat empat fungsi untuk menangani distribusi chi-square dalam pemrograman R yakni: dchisq(), pchisq(), qchisq(), dan rchisq().
Distribusi Chi-Square banyak digunakan dalam bidang statistika. Beberapa manfaat dari distribusi Chi-square seperti menguji signifikansi antara frekuensi yang diamati dengan frekuensi teoritis dan menguji kebebasan antar faktor pada tabel kontingensi.
Peubah acak kontinu X berdistribusi chi-square, dengan derajat bebas \(v\), bila fungsi padatnya diberikan oleh

dengan \(v\) bilangan bulat positif.
Terdapat empat fungsi untuk menangani distribusi chi square dalam pemrograman R yakni: dchisq(), pchisq(), qchisq(), dan rchisq().
                    dchisq(x, df, ncp = 0, log = FALSE)
                    pchisq(q, df, ncp = 0, lower.tail = TRUE, log.p = FALSE)
                    qchisq(p, df, ncp = 0, lower.tail = TRUE, log.p = FALSE)
                    rchisq(n, df, ncp = 0)
Argumen
x, q | vector of quantiles. |
p | vector of probabilities. |
n | number of observations. If length(n) > 1, the length is taken to be the number required. |
df | degrees of freedom (non-negative, but can be non-integer). |
ncp | non-centrality parameter (non-negative). |
log, log.p | logical; if TRUE, probabilities p are given as log(p). |
lower.tail | logical; if TRUE (default), probabilities are P[X ≤ x], otherwise, P[X > x]. |
                    library(dplyr)
                    library(ggplot2)
                    library(tidyr)

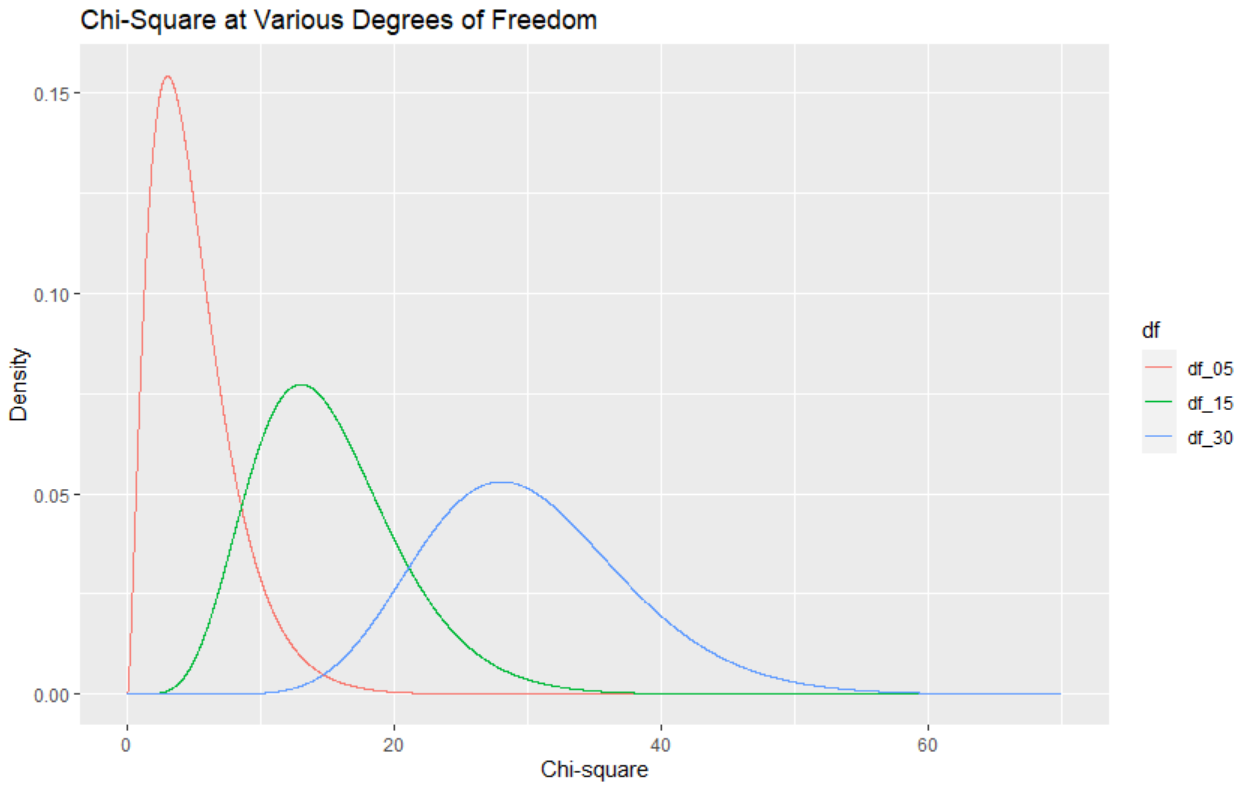
                    data.frame(chisq = 0:7000 / 100) %>%
                      mutate(df_05 = dchisq(x = chisq, df = 5),
                             df_15 = dchisq(x = chisq, df = 15),
                             df_30 = dchisq(x = chisq, df = 30)) %>%
                      gather(key = "df", value = "density", -chisq) %>%
                      ggplot() +
                      geom_line(aes(x = chisq, y = density, color = df)) +
                      labs(title = "Chi-Square at Various Degrees of Freedom",
                           x = "Chi-square",
                           y = "Density")

Artikel Terkait
Though you cannot go back and start again, you can start from now and have a brand new end.
Unknown
